
SNAP-tFDP: Massively Scalable Graph Layouts via Sparse Negative Sampling
Results Comparison of classical spring-electrical models and t-FDP models with different weighting schemes. Comparison of different degree-weighting schemes for (a) two high-degree nodes and (b) a high-degree node and a low-degree node. The attractive force Fat-FDP is identical in all cases and is shown as a black solid line. Product-based weighting (orange) produces overly strong relative repulsion and its normalized variant (purple) nearly eliminates repulsion for low-degree nodes, while linearly normalized degree weighting (red) provides effective balance.
08-05-2026
Visualization-Oriented Progressive Time Series Transformation
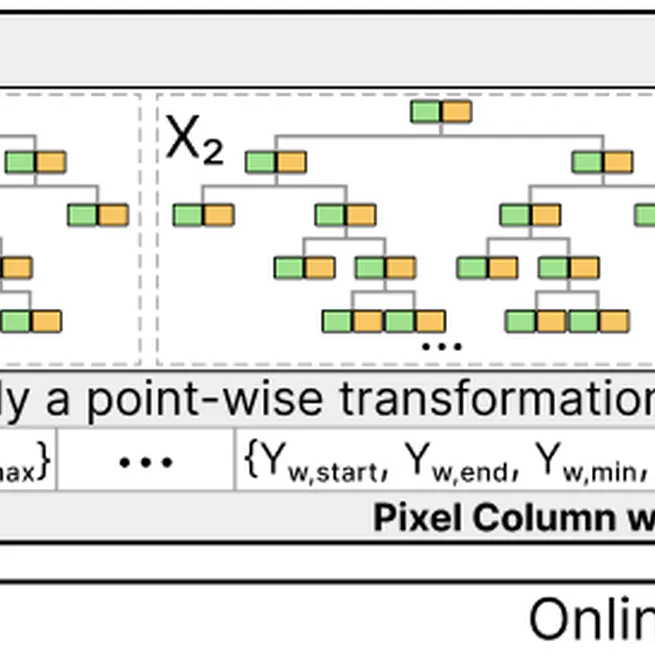
Results Visual analysis of multiple time series from a dataset of NYSE-listed stocks. Analysts may casually apply and compose various point-wise transformations to explore interesting patterns, expecting timely and highly accurate visualizations.
08-24-2025
OM3: An Ordered Multi-level Min-Max Representation for Interactive Progressive Visualization of Time Series
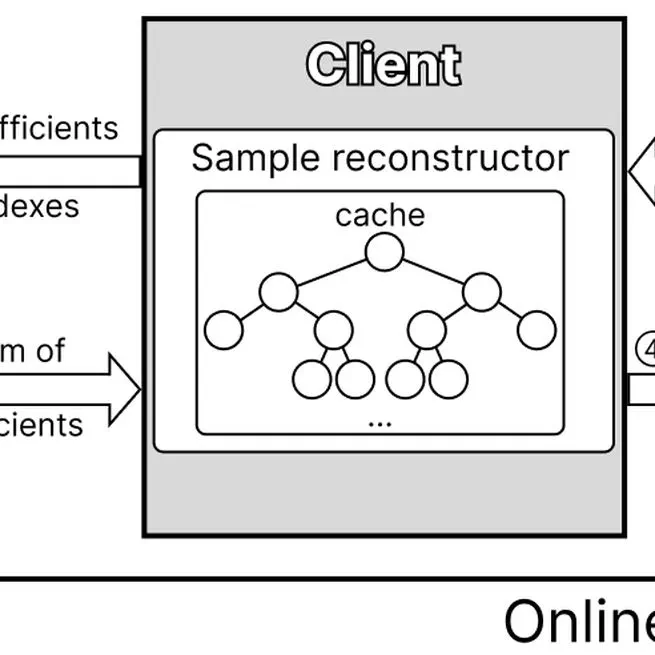
Results Illustrating the OM3 forward transform and the coefficients stored in the database. (a) The input data (bottom) with 16 samples is recursively transformed to build the four-level coefficient tree. Each tree node has two aggregate coefficients and two associated detail coefficients. To start, we replicate the input data twice to construct the coefficients at level 4, marked by the dotted box. (b) The initial database table stores the final two aggregate coefficients at the top (level 0) and all detail coefficients from the forward transforms; detail coefficients that are redundant for reconstructing the original data are marked by the blue box. (c) The additional database table stores all ordering coefficients. (d,e) Line visualizations (in black) reconstructed by the inverse transform from the aggregate coefficients on a two-pixel-wide window (d) and a four-pixel-wide window (e), where the pixels with the red boxes are missed.
06-20-2023